> For the complete documentation index, see [llms.txt](https://docs.datacake.de/llms.txt). Markdown versions of documentation pages are available by appending `.md` to page URLs; this page is available as [Markdown](https://docs.datacake.de/dashboards/widgets/cooling-health-widget.md).

# Cooling Health Widget

The Cooling Health Widget monitors refrigeration equipment — fridges, freezers, cold rooms and similar appliances — and condenses their temperature (and optionally humidity) data into a single **health score from 0 to 100**. Instead of reading raw temperature charts, you see at a glance whether an appliance is operating safely, how stable it runs, and what is going wrong when it isn't.

The widget is available on both **device dashboards** and **workspace dashboards**.

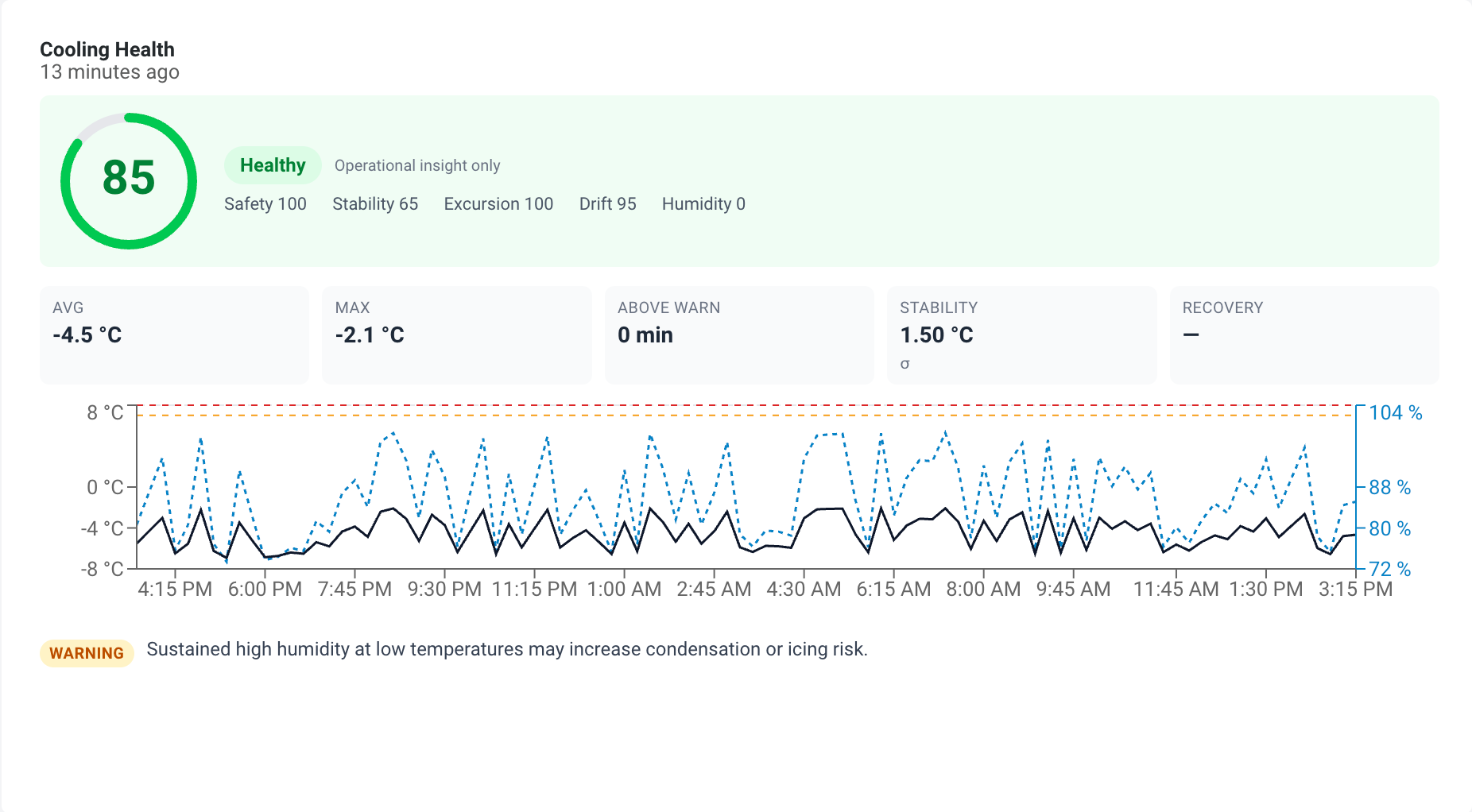
<figure><img src="/files/NclKdDB2ATO3pXAwj5Mk" alt=""><figcaption><p>The Cooling Health Widget with score ring, status, KPIs, timeline and insights</p></figcaption></figure>

The widget combines:

* A **score ring** with the overall health score and a status pill (**Healthy**, **Warning** or **Critical**), plus the individual sub-scores.
* **KPI cards** showing average and maximum temperature, time spent above the warning threshold, stability (standard deviation) and recovery time.
* A **timeline** plotting the temperature (and humidity) band against your thresholds.
* An **insights feed** that translates the metrics into plain-language findings, such as frequent door openings or condensation risk.

***

## Adding the Widget

1. Open your dashboard and enable **Edit Mode**.
2. Click **"Add Widget"**.
3. Select the **"Cooling Health"** widget.
4. Configure the widget as described below and click **Save**.

***

## Basics

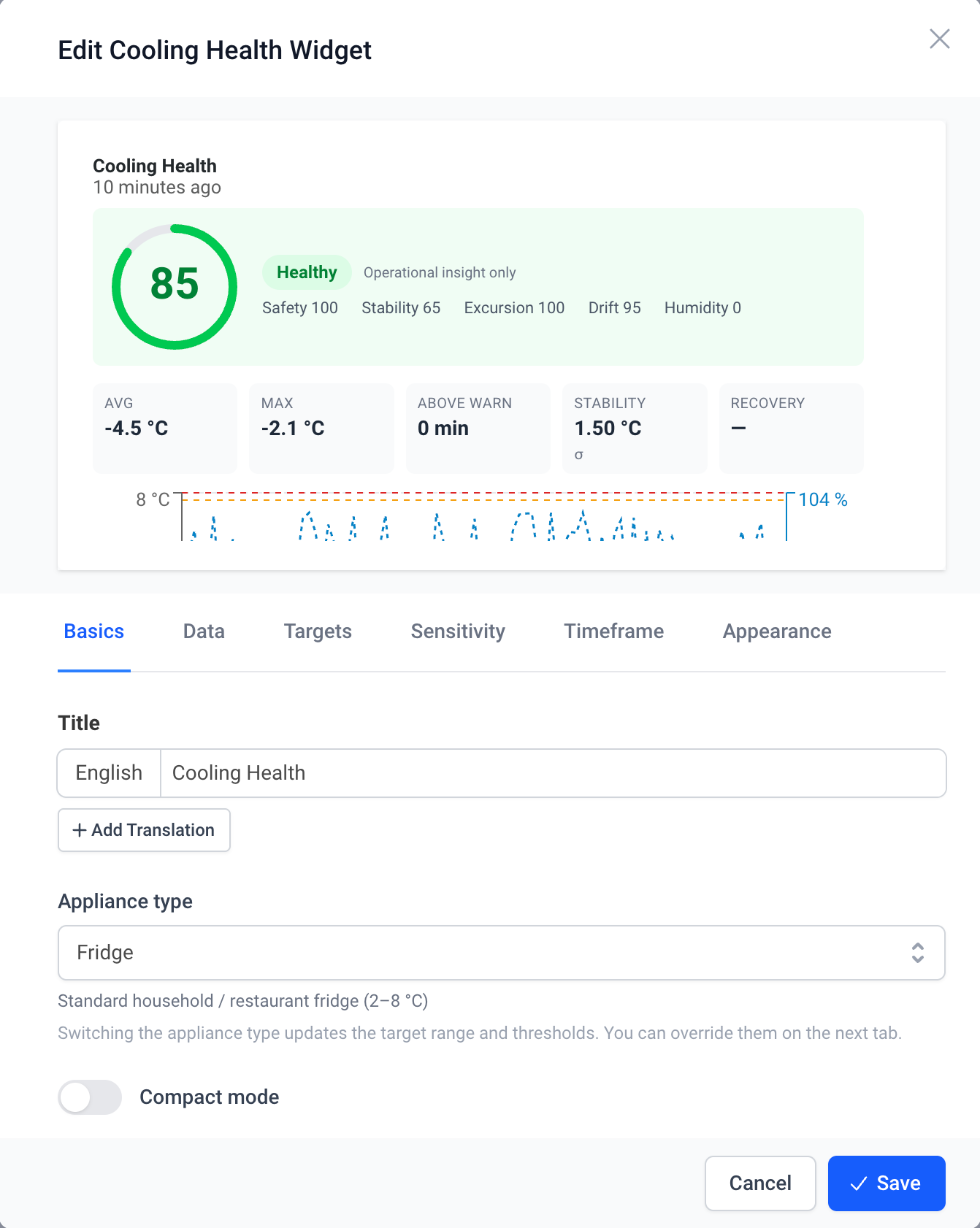
<figure><img src="/files/vQ99eqBR5YNH58znLOwg" alt=""><figcaption><p>Basics tab with title and appliance type</p></figcaption></figure>

**Title:** Assign a custom title to the widget, with optional translations.

**Appliance type:** Choose the kind of cooling equipment the widget monitors. Selecting an appliance type fills the target range, thresholds and humidity range on the **Targets** tab with sensible defaults:

| Appliance type  | Target range (°C) | Warning (°C) | Critical (°C) | Humidity range (%) |
| --------------- | ----------------- | ------------ | ------------- | ------------------ |
| Fridge          | 2 – 8             | 7            | 8             | 30 – 70            |
| Freezer         | −25 – −15         | −14          | −10           | —                  |
| Cold Room       | 0 – 10            | 9            | 12            | 30 – 80            |
| Medical Fridge  | 2 – 8             | 7            | 8             | 30 – 60            |
| Lab Fridge      | 2 – 10            | 9            | 12            | —                  |
| Food Storage    | 0 – 5             | 5            | 7             | 30 – 75            |
| Cooling Cabinet | 0 – 10            | 9            | 12            | —                  |

{% hint style="warning" %}
The presets are conservative starting points based on common refrigeration practice. Every value can be overridden on the **Targets** tab. They are **not regulatory or compliance advice** — the widget is an operational insight tool; always apply the target ranges and thresholds that your own regulations and processes require.
{% endhint %}

**Compact mode:** Shows only the score ring, status and the three most important KPIs — useful for small widgets or overview dashboards. The widget also switches to the compact layout automatically when it is sized too small to fit the full view.

***

## Data

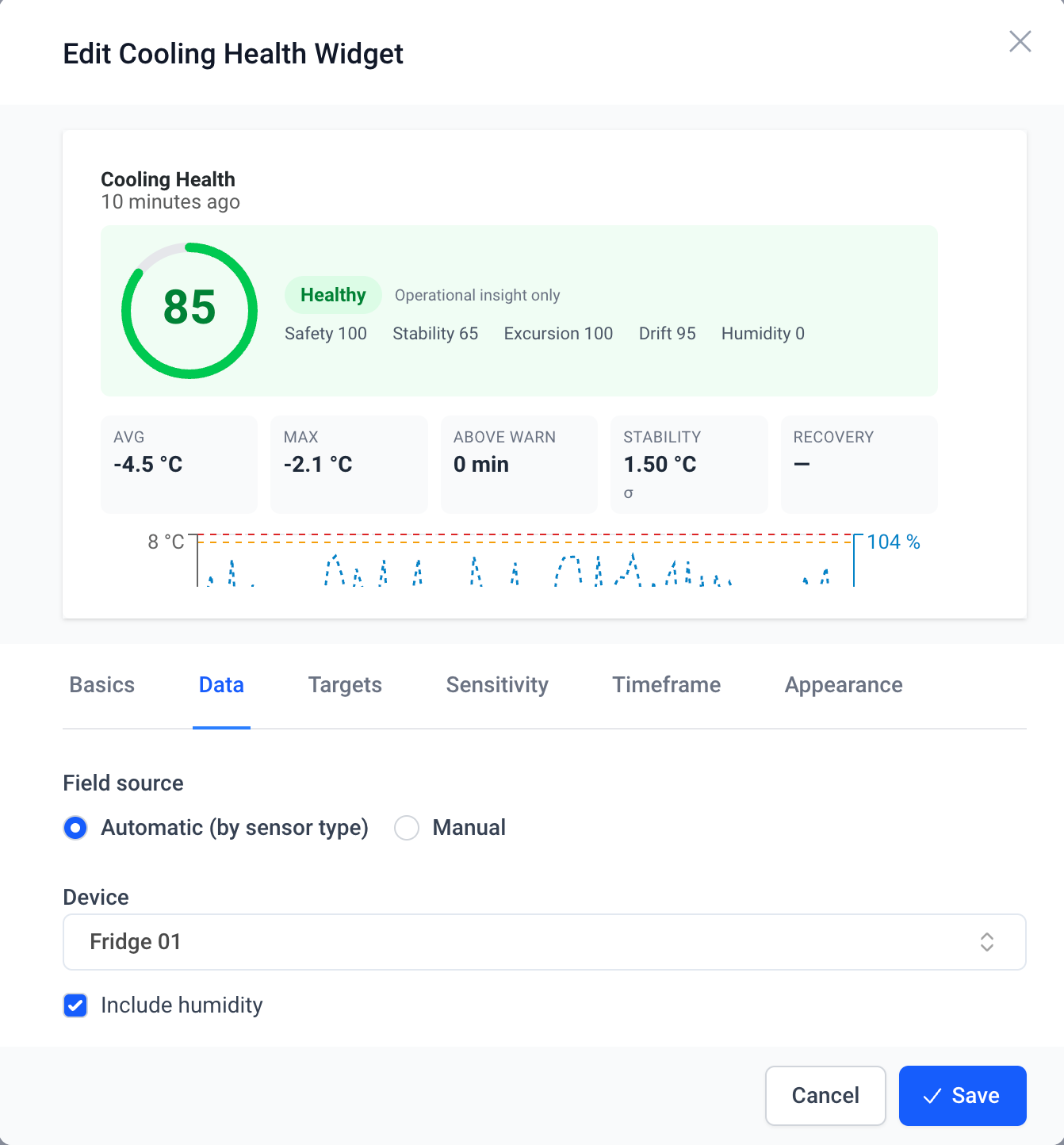
<figure><img src="/files/ixcVmuVIdYm1rGNw6FGE" alt=""><figcaption><p>Data tab with automatic field selection</p></figcaption></figure>

**Field source:** Choose how the widget finds its temperature and humidity data:

* **Automatic (by sensor type):** Datacake automatically uses the device's **temperature** and **humidity** fields based on their field semantics. You only select the device — on a device dashboard even that is filled in automatically, so the widget works with zero data configuration. Tick **Include humidity** to add humidity-based metrics (condensation risk, humidity spikes).
* **Manual:** Pick the exact device and field for temperature, and optionally for humidity. Use this when a device has several temperature fields (for example multiple probes) and you want to monitor a specific one.

{% content-ref url="/pages/TmCOrosPLbxaXIz2OpLS" %}
[Field Semantics](/field-semantics.md)
{% endcontent-ref %}

***

## Targets

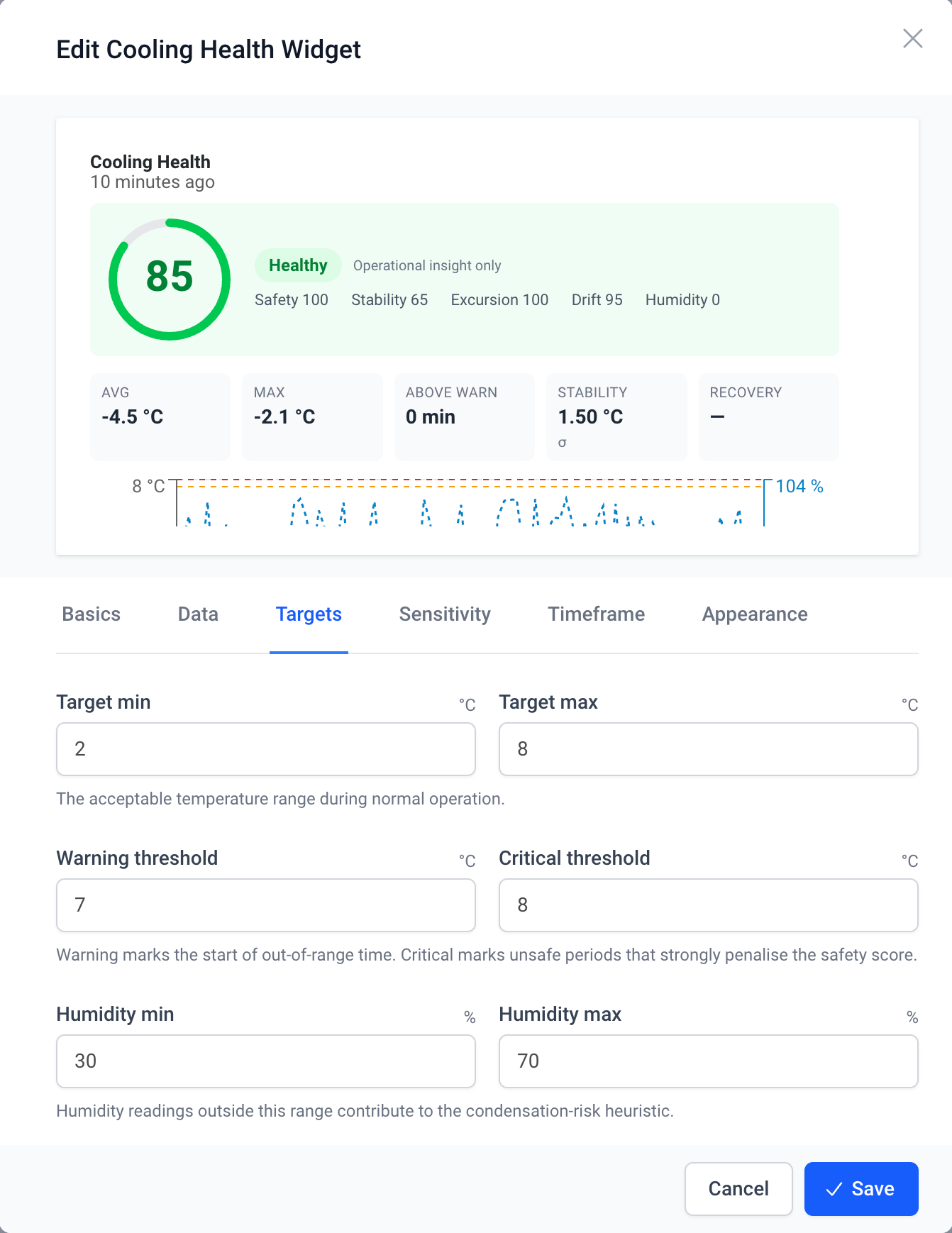
<figure><img src="/files/EeD2iOt5Xl3Ad8JRew5i" alt=""><figcaption><p>Targets tab with target range, thresholds and humidity range</p></figcaption></figure>

**Target min / Target max:** The acceptable temperature range during normal operation. Time spent outside this range counts against the health score.

**Warning threshold:** Marks the start of out-of-range time. Time above this temperature is tracked in the **Above warn** KPI and reduces the safety score.

**Critical threshold:** Marks unsafe periods. Any time above the critical threshold strongly penalises the safety score and immediately sets the widget status to **Critical**, regardless of the overall score.

**Humidity min / Humidity max** (only shown when humidity is configured)**:** Humidity readings outside this range contribute to the condensation-risk heuristic.

***

## The Health Score

The overall score is a weighted combination of individual sub-scores, each looking at a different aspect of how the appliance operates:

* **Safety** — how much time the temperature spent above the warning and critical thresholds. This is the most heavily weighted sub-score.
* **Stability** — how much the temperature fluctuates relative to your target range. A steadily running appliance scores high; one that constantly swings scores low.
* **Recovery** — how quickly the temperature returns to normal after a warm event (for example after the door was opened or new goods were loaded).
* **Excursion** — how frequently the temperature spikes above the warning threshold.
* **Drift** — whether the temperature slowly trends upwards or downwards over time, which can indicate a struggling cooling system.
* **Humidity** — humidity stability and condensation risk (only when humidity is configured).

Sub-scores that don't apply — for example Recovery when no excursion occurred, or Humidity without a humidity field — are left out of the calculation rather than counting against the score.

The status pill follows the score:

| Status       | Condition                                                          |
| ------------ | ------------------------------------------------------------------ |
| **Healthy**  | Score 80 or higher                                                 |
| **Warning**  | Score 60 – 79                                                      |
| **Critical** | Score below 60, **or** any time spent above the critical threshold |
| **Unknown**  | No data in the selected timeframe                                  |

***

## Sensitivity

**Sensitivity** controls how strictly deviations are penalised and how early insights are raised:

* **Low:** More lenient — suited to appliances in heavy daily use (frequent door openings) where short spikes are expected.
* **Medium:** Balanced default for most applications.
* **High:** Stricter — deviations reduce the score faster and insights trigger earlier. Suited to sensitive goods such as medical supplies.

**Show insights:** Toggles the insights feed below the timeline.

**Show timeline:** Toggles the temperature/humidity timeline chart.

***

## Insights

When enabled, the widget analyses the metrics and shows plain-language findings, each marked as info, warning or critical:

* Time spent above the **warning** or **critical** threshold.
* **Frequent short temperature spikes** — often a sign of repeated door openings.
* **Slow recovery** after warm events — the appliance takes longer than expected to cool back down.
* **Temperature drift** — the temperature is trending up or down over time, which may mean the cooling system is working harder than usual.
* **Humidity spikes** — combined with temperature spikes this often indicates door activity.
* **Condensation / icing risk** — sustained high humidity at low temperatures.
* When everything is fine, the widget simply reports that the temperature is stable and within the expected range.

***

## Timeline and Excursions

The timeline plots the temperature band (min/max per interval) against your target range and thresholds, with the humidity band on a second axis when configured. The resolution follows the widget's **Timeframe** setting (default: the last 24 hours at 5-minute resolution).

When excursions occurred in the selected timeframe, the **Above warn** KPI card becomes clickable and opens a detailed list of all excursion events, including when each one started, its peak temperature, how long it lasted and how long the appliance took to recover.

***

## Timeframe

Choose the period of historical data the health score is calculated over — for example the last 24 hours, the last week, or a custom timeframe — and the resolution of the timeline.

{% hint style="info" %}
The health score always describes the **selected timeframe**. A fridge that had a critical excursion yesterday will show a Critical status on a 7-day timeframe, but may already be Healthy again on a 24-hour timeframe.
{% endhint %}

***

## Appearance

**Tint Color:** Customize the widget's primary accent color.

**Highlight Color:** Customize the color used for highlighted elements.

**Hide Background:** Removes the widget background for a cleaner appearance.

**Hide Last Update:** Hides the timestamp showing when the widget was last updated.


---

# Agent Instructions
This documentation is published with GitBook. GitBook is the documentation platform designed so that both humans and AI agents can read, navigate, and reason over technical content effectively. Learn more at gitbook.com.

## Querying This Documentation
If you need additional information that is not directly available in this page, you can query the documentation dynamically by asking a question.

Perform an HTTP GET request on the current page URL with the `ask` query parameter, and the optional `goal` query parameter:

```
GET https://docs.datacake.de/dashboards/widgets/cooling-health-widget.md?ask=<question>&goal=<endgoal>
```

`ask` is the immediate question: it should be specific, self-contained, and written in natural language.
`goal` is optional and describes the broader end goal you are ultimately trying to accomplish on behalf of the user. GitBook uses it to tailor the answer towards what is most useful for that goal.

The response will contain a direct answer to the question and relevant excerpts and sources from the documentation.

Use this mechanism when the answer is not explicitly present in the current page, you need clarification or additional context, or you want to retrieve related documentation sections.